Premium  Download Edit
Download the Measurement and Data: Interpreting Line Plots CCSS 4.MD.4 Facts & Worksheets
Click the button below to get instant access to these worksheets for use in the classroom or at a home.
Download This Worksheet
This download is exclusively for KidsKonnect Premium members!
To download this worksheet, click the button below to signup (it only takes a minute) and you'll be brought right back to this page to start the download!
Sign Me Up
Edit This Worksheet
Editing resources is available exclusively for KidsKonnect Premium members.
To edit this worksheet, click the button below to signup (it only takes a minute) and you'll be brought right back to this page to start editing!
Sign Up
Not ready to purchase a subscription? Click to download the free sample version Download sample
Download This Sample
This sample is exclusively for KidsKonnect members!
To download this worksheet, click the button below to signup for free (it only takes a minute) and you'll be brought right back to this page to start the download!
Sign Me Up
Table of Contents
We can collect measurements as data. One way to collate these data is by creating a line plot.
See the fact file below for more information on the interpreting line plots or alternatively, you can download our 28-page Measurement and Data: Interpreting Line Plots CCSS 4.MD.4 worksheet pack to utilise within the classroom or home environment.
Key Facts & Information
LEARNING OBJECTIVE:
- At the end of the lesson, the student will be able to read line plots (estimated to fractions) as data that can be interpreted with addition or subtraction.
A NOTE FOR THE TEACHER:
- When interpreting line plots, take note of the following:
- Remember that the dots represent the specific subjects in the situation.
- Remember that the values in the number line represent values of measurements.
- Write the value of the fraction (if not written in the number line) to avoid confusion.
- Remind the student to reread the question and line plot.
THEORY:
- We can collect measurements as data. One way to collate these data is by creating a line plot.
- Recall that a line plot is a graph that shows data using a number line.
- A line plot has different parts:
- First, the number line that includes all the values in the data set. In this lesson’s context, the values in the number line are measurement values with fractions involved.
- Next, dots are placed above each data value (or each measurement) on the number line. We should note that when a value occurs more than once in the data set, a new dot is placed above the data value on the number line. Occurrences may happen more than once; thus, just place a dot above if it happens.
- Consider the data set below:
- Rachelle collected five stones and measured each of its mass. Each weight was rounded to the nearest ¼.
- Measurements of the five stones were: 2 ¼ g, 3 ½ g, 3 ½ g, 2 ½ g, 3 g.
- Notice that 3 ½ g is a recurring measurement value; thus, we should assume that two dots will be seen above the value 3 ½ on the number line.
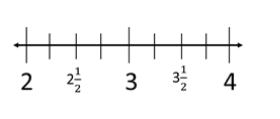
- We can create a number line from 2 until 4, and divide it into ¼.
- Number line:
- Plotting the values, the line plot will look like this:
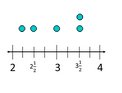
- We can now interpret the line plot by knowing that the sum of the 2 heaviest stones is 3 ½ + 3 ½. We can also now easily compare these measurements based on what is heavy than what.
- Note that interpreting line plots requires understanding relationships of the data sets to each other and the relationship of the data sets to its corresponding measurement value on the number line.
Measurement and Data: Interpreting Line Plots CCSS 4.MD.4 Worksheets
This is a fantastic bundle that includes everything you need to know about Measurement and Data: Interpreting Line Plots across 28 in-depth pages. These are ready-to-use worksheets that align with the Common Core CCSS code 4.MD.4 for Measurement and Data: Interpreting Line Plots.


Table of contents:
- A lesson plan
- Warm-up activity
- Math theory explained
- Assisted learning activities
- Independent learning activities
- Extension activities and games
- Answer keys
Link/cite this page
If you reference any of the content on this page on your own website, please use the code below to cite this page as the original source.
Link will appear as Measurement and Data: Interpreting Line Plots CCSS 4.MD.4 Facts & Worksheets: https://kidskonnect.com - KidsKonnect, May 28, 2021
Use With Any Curriculum
These worksheets have been specifically designed for use with any international curriculum. You can use these worksheets as-is, or edit them using Google Slides to make them more specific to your own student ability levels and curriculum standards.


