Premium
 Download
Edit
Download
Edit
Download the Measurement and Data: Using Rulers and Line Plots CCSS 3.MD.4 Facts & Worksheets
Click the button below to get instant access to these worksheets for use in the classroom or at a home.
Download This Worksheet
This download is exclusively for KidsKonnect Premium members!
To download this worksheet, click the button below to signup (it only takes a minute) and you'll be brought right back to this page to start the download!
Sign Me Up
Edit This Worksheet
Editing resources is available exclusively for KidsKonnect Premium members.
To edit this worksheet, click the button below to signup (it only takes a minute) and you'll be brought right back to this page to start editing!
Sign Up
Not ready to purchase a subscription? Click to download the free sample version Download sample
Download This Sample
This sample is exclusively for KidsKonnect members!
To download this worksheet, click the button below to signup for free (it only takes a minute) and you'll be brought right back to this page to start the download!
Sign Me Up
Table of Contents
To measure objects with a ruler is very simple and straightforward. First, make sure that the end of what you’re measuring is aligned with the 0 on the rule. Then, we must see where the other end of the object falls on the ruler.
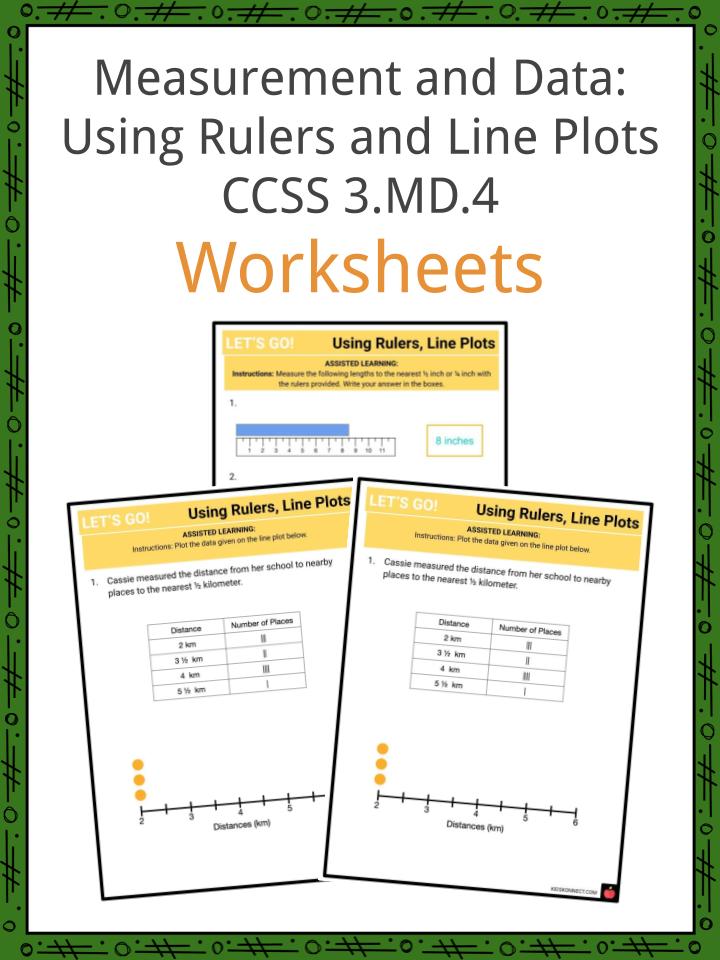
See the fact file below for more information on the using rulers and line plots or alternatively, you can download our 26-page Measurement and Data: Using Rulers and Line Plots CCSS 3.MD.4 worksheet pack to utilise within the classroom or home environment.
Key Facts & Information
LEARNING OBJECTIVE
- At the end of the lesson, students will be able to measure lengths using rulers marked with halves and fourths of an inch. Students will also be able to read and analyse data presented on a line plot and make their own line plots.
A NOTE FOR THE TEACHER
- When teaching Using Rulers and Line Plots, take note of the following:
- Point out to the student the difference in divisions between whole numbers. There will usually be divisions of halves and quarters.
- Relate these divisions to fractions on a number line.
THEORY
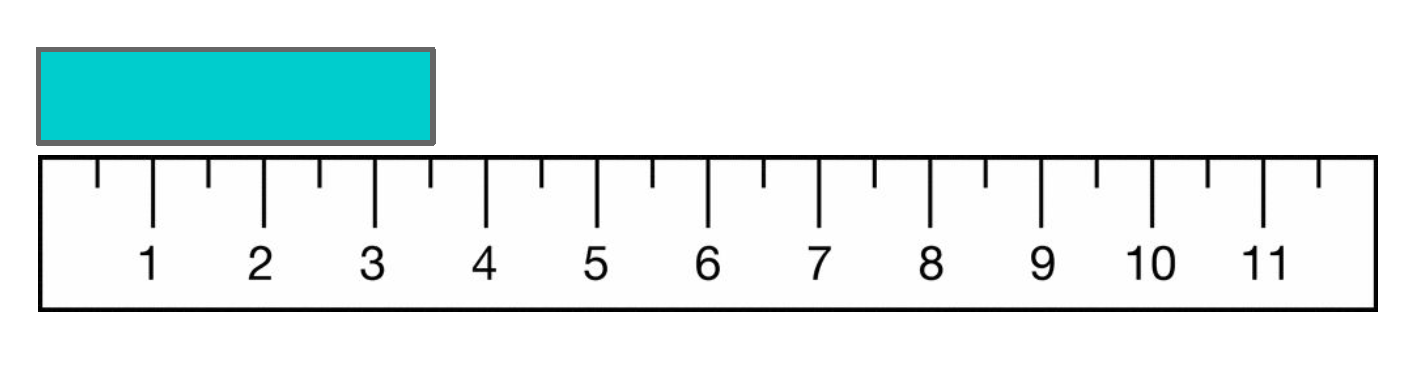
- To measure objects with a ruler is very simple and straightforward. First, make sure that the end of what you’re measuring is aligned with the 0 on the rule. Then, we must see where the other end of the object falls on the ruler. The point at which the end of the object falls on is its measurement.
- We must also be alert to how many divisions a ruler has between whole numbers. We will usually see inch rulers divided into halves of an inch or quarters of an inch.
- In our example below, we can tell that the bar has a measure of 3½ inches.
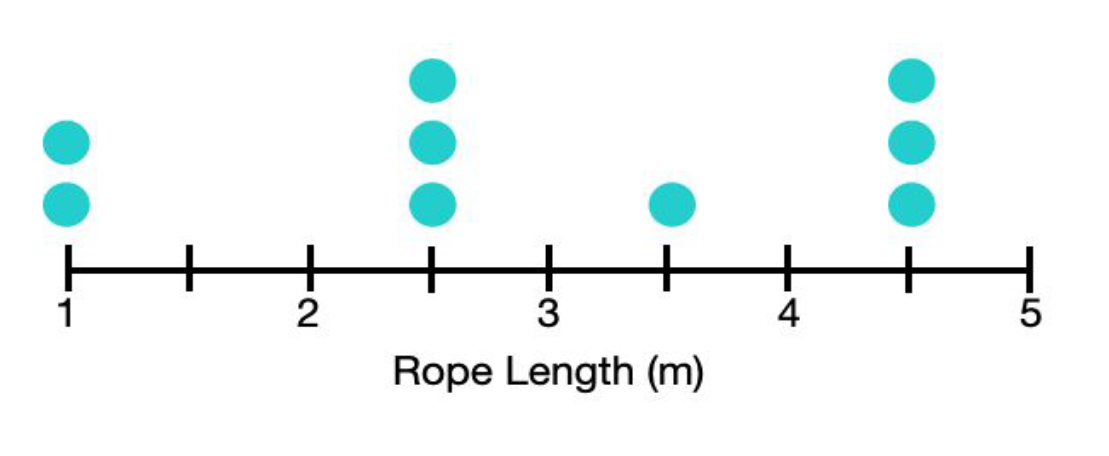
- A line plot is a type of graph that allows us to see how many instances of each value can be seen in the given data. In other words, it is a number line with dots above its points. These dots tell us how many times a value appears in the data given. Let’s look at the data below and see how we can put these values in a line plot.
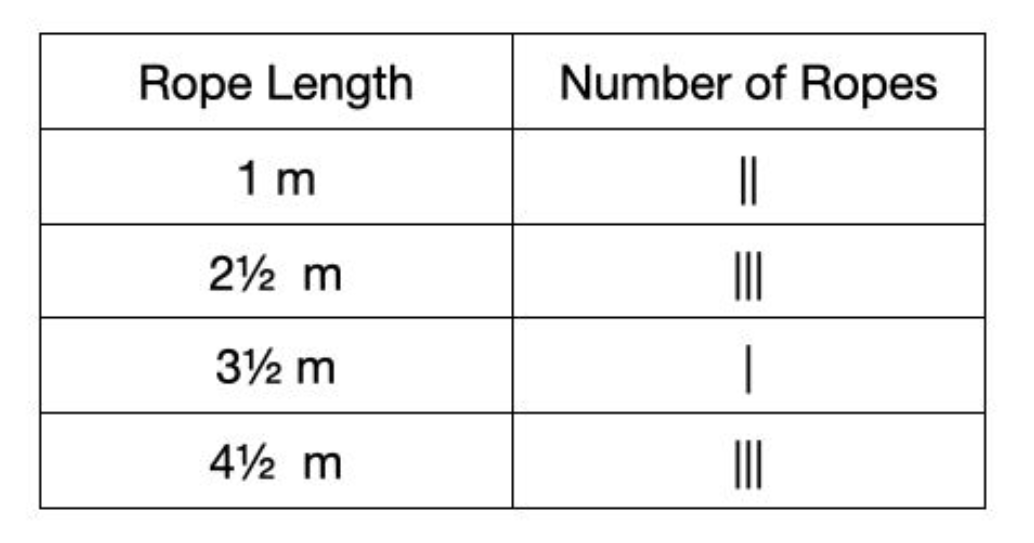
- Plotting this given data on the line plot is as simple as counting how many tallies are there for each rope length and drawing them as circles on top of the line plot.
Measurement and Data: Using Rulers and Line Plots CCSS 3.MD.4 Worksheets
This is a fantastic bundle that includes everything you need to know about Measurement and Data: Using Rulers and Line Plots across 26 in-depth pages. These are ready-to-use worksheets that align with the Common Core CCSS code 3.MD.4 for Measurement and Data: Using Rulers and Line Plots.
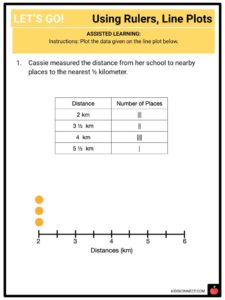
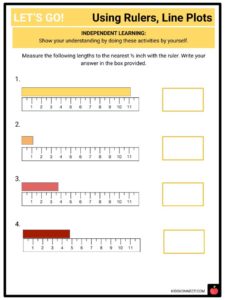
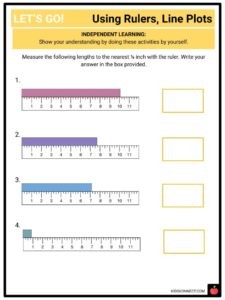
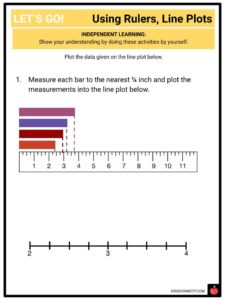
Table of contents:
- A lesson plan
- Warm-up activity
- Math theory explained
- Assisted learning activities
- Independent learning activities
- Extension activities and games
- Answer keys
Link/cite this page
If you reference any of the content on this page on your own website, please use the code below to cite this page as the original source.
Link will appear as Measurement and Data: Using Rulers and Line Plots CCSS 3.MD.4 Facts & Worksheets: https://kidskonnect.com - KidsKonnect, June 25, 2021
Use With Any Curriculum
These worksheets have been specifically designed for use with any international curriculum. You can use these worksheets as-is, or edit them using Google Slides to make them more specific to your own student ability levels and curriculum standards.