Premium  Download Edit
Download the Understanding Data Sets Facts & Worksheets
Click the button below to get instant access to these worksheets for use in the classroom or at a home.
Download This Worksheet
This download is exclusively for KidsKonnect Premium members!
To download this worksheet, click the button below to signup (it only takes a minute) and you'll be brought right back to this page to start the download!
Sign Me Up
Edit This Worksheet
Editing resources is available exclusively for KidsKonnect Premium members.
To edit this worksheet, click the button below to signup (it only takes a minute) and you'll be brought right back to this page to start editing!
Sign Up
Not ready to purchase a subscription? Click to download the free sample version Download sample
Download This Sample
This sample is exclusively for KidsKonnect members!
To download this worksheet, click the button below to signup for free (it only takes a minute) and you'll be brought right back to this page to start the download!
Sign Me Up
Table of Contents
In this lesson, we will learn how to plot numerical data and how we can summarize numerical data sets in relation to their context.
See the fact file below for more information on the understanding data sets or alternatively, you can download our 29-page Understanding Data Sets worksheet pack to utilise within the classroom or home environment.
Key Facts & Information
INTRODUCTION
- A data set is a set or collection of data used to describe or represent values.
- There are different types of data sets when it comes to statistics. Some of them are:
- Bivariate data sets – this type of data set has two variables, which is why it is called a bivariate data set, and it deals with the relationship of the two variables.
- Multivariate data sets – this type of data set has multiple variables.
- Categorical data sets – this type of data set usually represents features or characteristics of a person or an object.
- However, in this lesson we will be using numerical data sets.
- A numerical data set is a type of data set that deals with numerical values only.
DOT PLOT
- Plotting is a graphical technique that is applied to represent a data set for better description and visualization of the relationship between the variables.
- One type of plot is the dot plot.
- Dot plot (also called dot chart or strip plot) is a type of a plot that is commonly used to represent small data sets wherein the numerical values fall into categories or groups.
MEAN
- Before we proceed to the other types of plotting techniques, let us discuss the different measures of central tendency and how they are computed.
- First is the mean.
- The mean is the average value of the numerical data in a numerical data set.
- To get the mean, we must find the sum of all the numerical data and then divide it by the total count.
- Let us use the data set below:
- Score: 60 46 63 51 52 43 40 55 65
- The table above shows us the scores ranging from 40 to 65. Now, let us solve for the mean or average.
- mean = (60 + 46 + 63 + 51 +52 + 43 + 40 + 55 + 65)/9
- mean = ~52.78
- Thus, the mean of the data set is 52.78 (rounded off).
MEDIAN
- Next is the median. The median is the middle score or value in a given data set, when it is arranged in order of magnitude.
- We will use the same data set we used in the mean section.
- Since there are 9 datum in the data set, we can just arrange the numbers in numerical order and then find the middle number.
- Thus, the median of the data set is 52.
- We were able to easily find the median by arranging the numbers and looking for the middle number, since the count of the numbers is equal to 9 (an odd number). What if we have 10 (an even number)?
- Score: 60 46 63 51 52 55 43 40 55 65
- The count of values above is 10, and we have already arranged them in order of magnitude.
- What we need to do is find the two middle numbers. In this case, we have 52 and 55.
- After than, we just need to find the average of those two numbers.
- Thus, the median of the data set above is 53.5
MODE
- The mode represents the most frequent value or number in our data set.
- Score: 40 43 46 51 43 46 52 51 50 46
- Looking at the data set above, we can give the count of each score earned.
- 40 – 1
- 43 – 2
- 46 – 3
- 50 – 1
- 51 – 1
- 52 – 1
- From the count, we know that the score 46 is the one that appeared the most (3 times). Thus, this is the mode of our data set.
BOXPLOTS
- Now that we have an idea of the different measures of central tendency, let us discuss the second plotting technique – boxplot.
- A boxplot is also called a whisker plot, and it is a way to show the spread and centers of a data set. Measures of spread include the interquartile range and the mean of the data set. Meanwhile, the measures of center include the mean and the median.
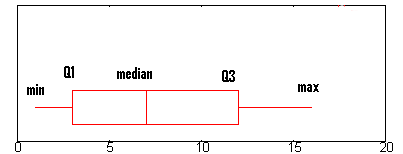
- The min is the minimum value in the data set – the smallest number.
- The max is the maximum value in the data set – the largest number.
- Median, as explained in the previous section, is the middle value.
- Q1, or Quartile 1, is the median of the lower half of the data set.
- Q3, or Quartile 3, is the median of the upper half of the data set.
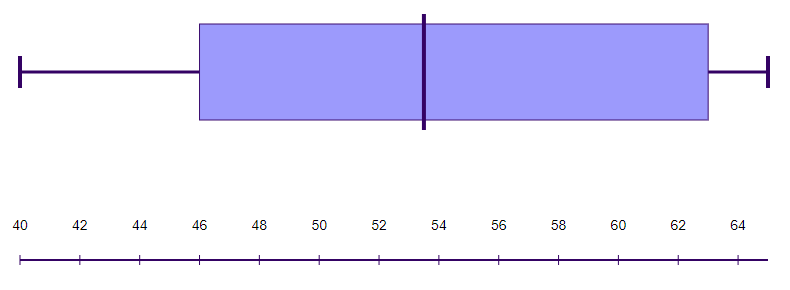
- Score 40 43 46 51 52 55 60 63 64 65
- We know that the median of the data set presented above is 53.5, as we previously computed. With this, we have to first identify the lower and upper halves.
- Note that the lower half must be less than the median, while the upper half is greater than the median. Since 53.5 is our median, the numbers on the left side are the lower half.
- Therefore, the numbers on the right side are the upper half.
- Now that we know that, we need to understand that the position of the Q1 is the median of the lower half. Therefore, we need to find the median of the lower half – which is 46.
- In addition, Q3 is the median of the upper half, which is 63 in our data set.
- Now that we know the Q1, Q3, and median values, we have to identify the min and max.
- Min is smallest number which is 40, while max is the largest number which is 65.
- With all 5 values identified, we can now plot our boxplot.
Understanding Data Sets Worksheets
This is a fantastic bundle which includes everything you need to know about the understanding data sets across 29 in-depth pages. These are ready-to-use Understanding Data Sets worksheets that are perfect for teaching students how to plot numerical data and how we can summarize numerical data sets in relation to their context.


Complete List Of Included Worksheets
- Lesson Plan
- Understanding Data Sets
- Plot
- Organize
- Find MEan
- The Median
- Color
- Differentiate
- First Q
- Q3
- B&W
- Describe
Link/cite this page
If you reference any of the content on this page on your own website, please use the code below to cite this page as the original source.
Link will appear as Understanding Data Sets Facts & Worksheets: https://kidskonnect.com - KidsKonnect, December 16, 2020
Use With Any Curriculum
These worksheets have been specifically designed for use with any international curriculum. You can use these worksheets as-is, or edit them using Google Slides to make them more specific to your own student ability levels and curriculum standards.


