Premium
 Download
Edit
Download
Edit
Download the Understanding Statistical Variability Facts & Worksheets
Click the button below to get instant access to these worksheets for use in the classroom or at a home.
Download This Worksheet
This download is exclusively for KidsKonnect Premium members!
To download this worksheet, click the button below to signup (it only takes a minute) and you'll be brought right back to this page to start the download!
Sign Me Up
Edit This Worksheet
Editing resources is available exclusively for KidsKonnect Premium members.
To edit this worksheet, click the button below to signup (it only takes a minute) and you'll be brought right back to this page to start editing!
Sign Up
Not ready to purchase a subscription? Click to download the free sample version Download sample
Download This Sample
This sample is exclusively for KidsKonnect members!
To download this worksheet, click the button below to signup for free (it only takes a minute) and you'll be brought right back to this page to start the download!
Sign Me Up
Table of Contents
In this lesson, we will learn about the basics of statistics through recognizing statistical questions and sets of data collected to answer a statistical question. Moreover, we will also distinguish measures of center for a numerical data set and measures of variation.
See the fact file below for more information on the understanding statistical variability or alternatively, you can download our 30-page Understanding Statistical Variability worksheet pack to utilise within the classroom or home environment.
Key Facts & Information
INTRODUCTION
- Statistics is a form of mathematical analysis that uses quantified models, representations, and synopses for a given set of experimental data or real-life studies.
- Statistical methods are mainly useful to ensure that your data are interpreted correctly.
- In statistics, we try to make sense of the world by collecting, organizing, analyzing, and presenting large amounts of data.
- For instance, you may survey your friends about what chick flick is the most popular. However, the small sample size will not give you an accurate idea of what all of your 6th grade classmates like to watch.
- To perform this, you must survey a cross section of students from all around the world and all backgrounds. The data can be statistically analyzed to give a more accurate picture of what chick flick is most popular.
DATA ANALYSIS PROCESS
- Data are individual pieces of factual information recorded and used for the purpose of analysis. It is raw information from which statistics are created.
- Data is collected from a population or group. When a population is so big that collecting data from every member of the population is impractical, data is collected from a sample, or a part of the population.
- One of the most vital tasks a statistician has when collecting data from a sample is to make sure that it is a random sample and not a biased sample.
- Step 1. Decide on the objectives or pose a question
- The first step is to decide on the objectives. These objectives may usually require significant data collection and analysis.
- Step 2. What to measure and how to measure
- Measurement generally refers to the assigning of numbers to indicate different values of variables.
- For example, out of curiosity, you want to know the relationship of one’s height and weight, also known as BMI.
- There are 2 variables you need to look for. First is the height, and second is the weight. You can get these values by using a weighing scale and a measuring tape.
- Step 3. Data collection
- Once you know what types of data you need for your statistical study, then you can determine whether your data can be gathered from existing sources/databases or not.
- If the data is not sufficient, then you have to collect new additional data. This will help you understand and determine the limitations of the generalizability of results as you conduct a proper analysis.
- The more data you have, the better correlations you will find. Thus, building better models and finding more actionable insight will be easier. Data from more diverse sources also helps make this job easier.
- Correlation is the mutual relationship or connection between two or more things.
- Step 4. Removing unnecessary data
- This is a crucial step in data analysis, as doing so improves data quality.
- Data scientists correct spelling mistakes, handle missing values, and remove useless information.
- This is the most critical step, because junk data will generate inappropriate results and mislead the whole process.
- Step 5. Summarizing and visualizing data
- Exploratory data analysis helps you understand the data better. Using visual representation of the data, such as graphs and charts, is worth a thousand words, as many people understand pictures better than lectures. Likewise, measures of variance indicate the distribution of the data around the center.
- Variance is the fact or quality of being different, divergent, or inconsistent (opposite of correlation).
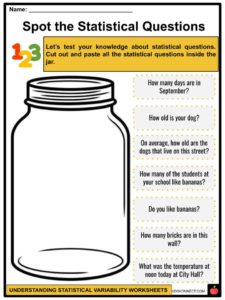
RECOGNIZING STATISTICAL QUESTIONS
- A statistical question is one that can be answered by collecting data and where there will be variability in that data.
- For example, “How many minutes do 6th grade students typically spend on homework each week?”
- We could answer this question by collecting data from 6th graders, and we expect that not all 6th graders spend the same amount of hours working on their homework. This means there will be variability in the data.
- “How much time did Juno spend on homework last night?” is not a statistical question, since the answer can be easily determined, and this question is not answered by collecting data that could vary.
MEASURES OF CENTRAL TENDENCY
- A measure of central tendency is a summary statistic that represents the center point or typical value of a given set of data.
- In statistics, the three most fundamental measures of central tendency are the mean, median, and mode.
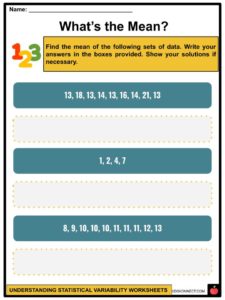
- The mean is basically the average of the data set.
- Example: Find the mean of the following set of data { 5 9 1 3 8 4 }.
- Therefore, the mean is 5.
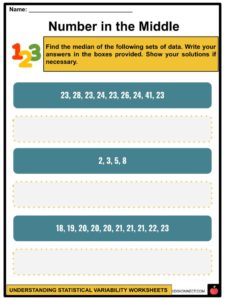
- The median is the middle value of the set of data.
- Example: Find the median of the following set of data { 5 9 1 3 8 4 }.
- First, arrange the set of data in ascending order.
- { 1 3 4 5 8 9 }
- Get the middlemost value of the data set. If there is an even number of items in the data set, then the median is found by taking the mean (average) of the two middlemost numbers.
- Therefore, the median is 4.5
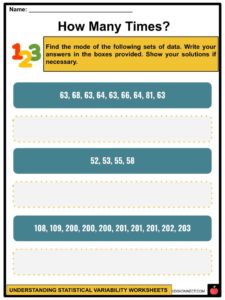
- The mode is the most frequent or most occuring number in a data set.
Example: Find the mode of the following set of data { 5 9 1 1 8 4 }. - { 5 9 1 1 8 4 }
- Tally the number of times each number appears in the data set. The most occuring number will serve as the mode.
- 5 = 1
9 = 1
1 = 2
8 = 1
4 = 1 - The most recurring number in the data set is 1. Therefore, the mode is 1.
- If there are no recurring numbers in the data set, then there is no mode.
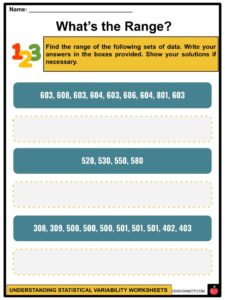
- The range is the difference between the largest and the smallest value in a data set.
- Example: Find the range of the following set of data { 5 9 1 3 8 4 }.
- Given the dataset, the highest value is 9 and the lowest value is 1. To compute for the range, we get the difference of the highest and the lowest value.
- The difference between 9 and 1 is 8. Therefore, the range is 8.
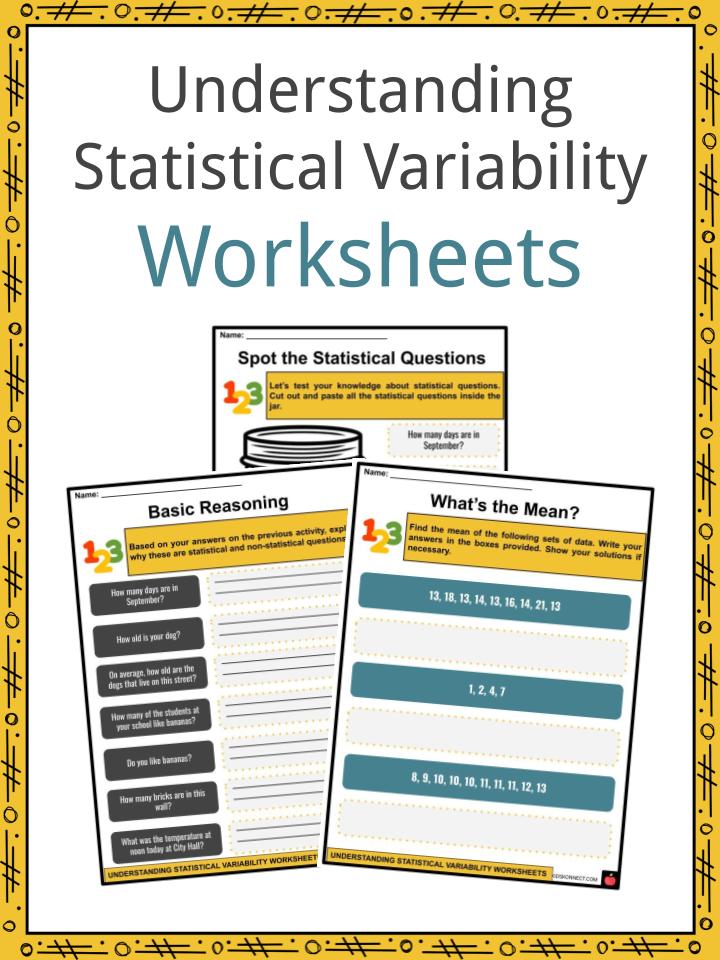
Understanding Statistical Variability Worksheets
This is a fantastic bundle which includes everything you need to know about the understanding statistical variability across 30 in-depth pages. These are ready-to-use Marshall Plan worksheets that are perfect for teaching students about the basics of statistics through recognizing statistical questions and sets of data collected to answer a statistical question. Moreover, we will also distinguish measures of center for a numerical data set and measures of variation.
Complete List Of Included Worksheets
- Lesson Plan
- Understanding Statistical Variability
- Spot the Statistical Questions
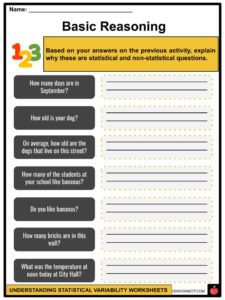
- Basic Reasoning
- What’s the Mean?
- Number in the Middle
- How Many Times?
- What’s the Range?
- Missing Grade
- Sign Up For What?
- PR Problems
- Test Yourself!
Link/cite this page
If you reference any of the content on this page on your own website, please use the code below to cite this page as the original source.
Link will appear as Understanding Statistical Variability Facts & Worksheets: https://kidskonnect.com - KidsKonnect, July 5, 2020
Use With Any Curriculum
These worksheets have been specifically designed for use with any international curriculum. You can use these worksheets as-is, or edit them using Google Slides to make them more specific to your own student ability levels and curriculum standards.