Premium
 Download
Edit
Download
Edit
Download the Measurement and Data: Generate Measurement and Data CCSS 2.MD.9 Facts & Worksheets
Click the button below to get instant access to these worksheets for use in the classroom or at a home.
Download This Worksheet
This download is exclusively for KidsKonnect Premium members!
To download this worksheet, click the button below to signup (it only takes a minute) and you'll be brought right back to this page to start the download!
Sign Me Up
Edit This Worksheet
Editing resources is available exclusively for KidsKonnect Premium members.
To edit this worksheet, click the button below to signup (it only takes a minute) and you'll be brought right back to this page to start editing!
Sign Up
Not ready to purchase a subscription? Click to download the free sample version Download sample
Download This Sample
This sample is exclusively for KidsKonnect members!
To download this worksheet, click the button below to signup for free (it only takes a minute) and you'll be brought right back to this page to start the download!
Sign Me Up
Table of Contents
Measurements can show trends and patterns of certain objects. At the end of the lesson, the student will learn how to generate measurement data by measuring lengths of several objects.
See the fact file below for more information on the generate measurement and data or alternatively, you can download our 27-page Measurement and Data: Generate Measurement and Data CCSS 2.MD.9 worksheet pack to utilise within the classroom or home environment.
Key Facts & Information
LEARNING OBJECTIVE
- At the end of the lesson, the student will learn how to generate measurement data by measuring lengths of several objects to the nearest whole and then making a line plot, where the horizontal scale is marked off in whole-number units.
A NOTE FOR THE TEACHER
- When generating measurement data, take note of the following:
- Know if all the data have the same unit.
- Create a horizontal line similar to the characteristics of a number line that has equal intervals of tick marks.
- Dots are placed above the value of the data. Multiple dots can be placed.
THEORY
- Measurements can show trends and patterns of certain objects.
- For example, the length of a growing plant can be measured multiple times to observe the growth of its height.
- With these measurements, we can collect data. These measurement data can be represented by different tables and graphs. A common representation of data is shown by a line plot. It is a graph that shows data using a number line.
- A line plot has different parts:
- First, the number line that includes all the values in the data set. In this lesson’s context, the values in the number line are measurement values to the nearest whole numbers. Next, dots are placed above each data value (or each measurement) on the number line. We should note that when a value occurs more than once in the data set, a new dot is placed above the data value on the number line. Occurrences may happen more than once; thus, just place a dot above if it happens.
- Consider the table containing the length of 5 sticks in inches:
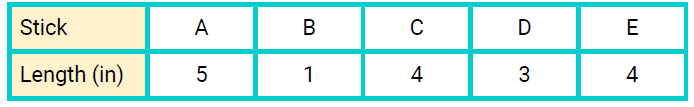
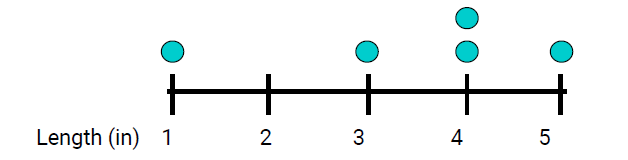
- Converting this data into a line plot, we will create a number line that contains the range of whole numbers. The data ranges from 1 inch to 5 inches. Next, we will place dots above the corresponding length of the plant. Note that there are two sticks that measure 4 inches; thus, two dots will be seen above 4.
- This will be the line plot for the generated measurement data:
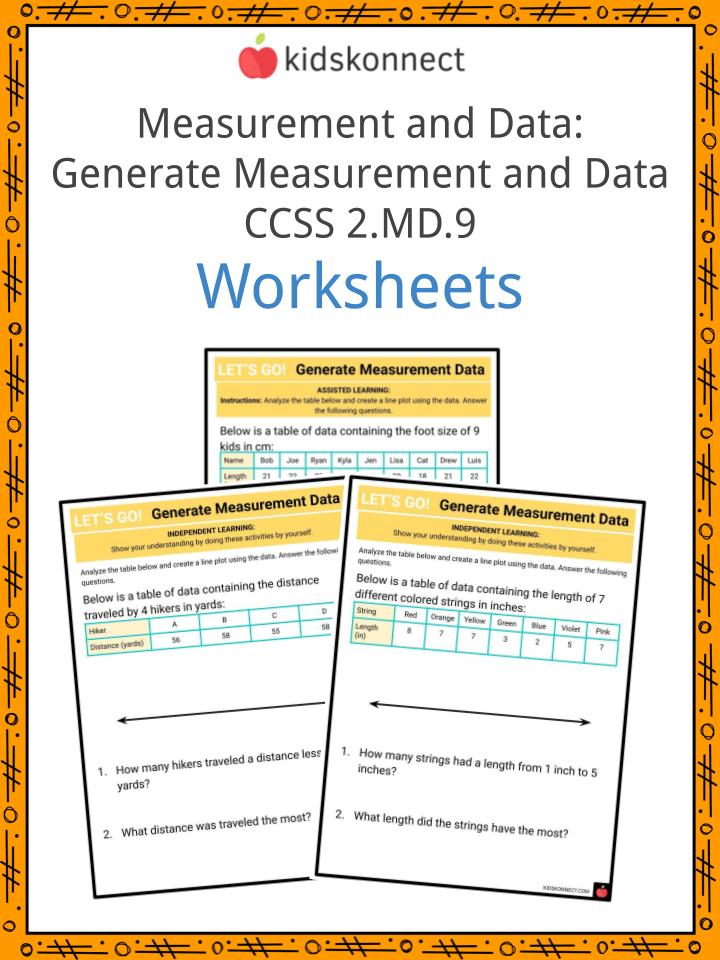
Measurement and Data: Generate Measurement and Data CCSS 2.MD.9 Worksheets
This is a fantastic bundle that includes everything you need to know about Measurement and Data: Generate Measurement and Data across 27 in-depth pages. These are ready-to-use worksheets that align with the Common Core CCSS code 2.MD.9 for Measurement and Data: Generate Measurement and Data.
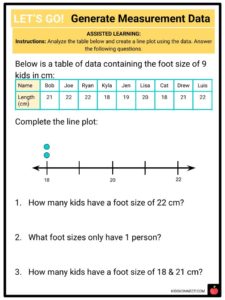
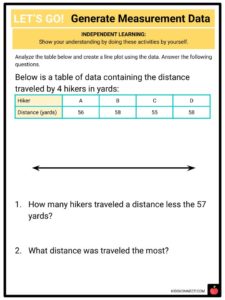
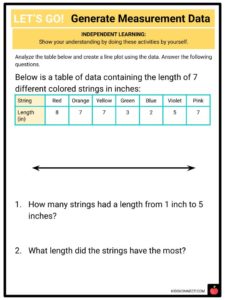
Table of contents:
- A lesson plan
- Warm-up activity
- Math theory explained
- Assisted learning activities
- Independent learning activities
- Extension activities and games
- Answer keys
Link/cite this page
If you reference any of the content on this page on your own website, please use the code below to cite this page as the original source.
Link will appear as Measurement and Data: Generate Measurement and Data CCSS 2.MD.9 Facts & Worksheets: https://kidskonnect.com - KidsKonnect, August 14, 2021
Use With Any Curriculum
These worksheets have been specifically designed for use with any international curriculum. You can use these worksheets as-is, or edit them using Google Slides to make them more specific to your own student ability levels and curriculum standards.