Premium
 Download
Edit
Download
Edit
Download the Analyzing Proportional Relationships Facts & Worksheets
Click the button below to get instant access to these worksheets for use in the classroom or at a home.
Download This Worksheet
This download is exclusively for KidsKonnect Premium members!
To download this worksheet, click the button below to signup (it only takes a minute) and you'll be brought right back to this page to start the download!
Sign Me Up
Edit This Worksheet
Editing resources is available exclusively for KidsKonnect Premium members.
To edit this worksheet, click the button below to signup (it only takes a minute) and you'll be brought right back to this page to start editing!
Sign Up
Not ready to purchase a subscription? Click to download the free sample version Download sample
Download This Sample
This sample is exclusively for KidsKonnect members!
To download this worksheet, click the button below to signup for free (it only takes a minute) and you'll be brought right back to this page to start the download!
Sign Me Up
Table of Contents
In this lesson, we will try to analyze proportional relationships and use them to solve real-world and mathematical problems. We will compute unit areas and other quantities, recognize and represent proportional relationships between quantities, and use proportional relationships to solve multistep ratio problems.
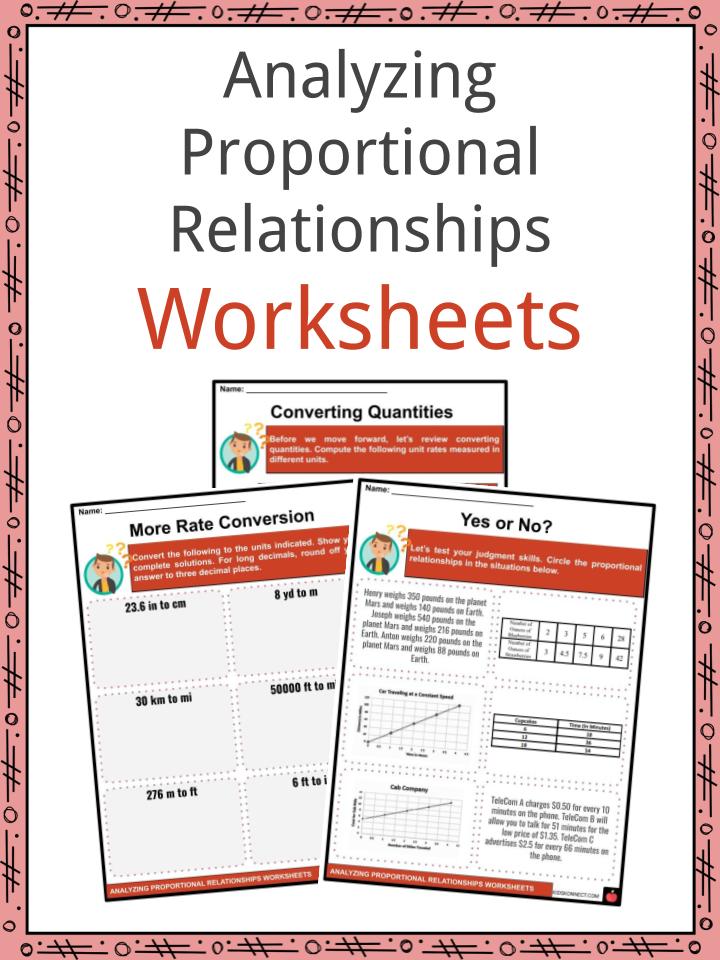
See the fact file below for more information on the analyzing proportional relationships or alternatively, you can download our 28-page Analyzing Proportional Relationships worksheet pack to utilise within the classroom or home environment.
Key Facts & Information
PROPORTIONAL RELATIONSHIPS
- A proportional relationship is one in which the ratio of the inputs to the outputs is constant.
- For example, the ratio of people who watched Discovery Channel to total TV viewers is 2:5 and the ratio of women to men at a university is 4:3.
- Proportional relationships are always written in the form y = kx, for some constant value k. The constant k is called the constant of proportionality.
- Sometimes, it is useful to use another form of the equation, k = y/x.
- Example. John earns $12 an hour at his part-time job. Show that the relationship between the amount he earned and the number of hours he worked is a proportional relationship. Then write the equation for the relationship.
- Step 1. Make a table relating amount earned to number of hours.
- For every hour John works, he earns $12. So, for 8 hours of work, he earns 8 x $12 = $96.
- Step 2. For each number of hours, write the relationship of the amount earned and the number of hours as a ratio in simplest form.
- Since the ratios for the two quantities are all equal to 12/1, the relationship is proportional.
- Step 3. Write an equation.
- Let x represent the number of hours. Let y represent the amount earned.
- Use the ratio as the constant of proportionality in the equation y = kx.
The equation is y = (12/1)x or y = 12x.
REPRESENTING PROPORTIONAL RELATIONSHIPS WITH GRAPHS
- You can represent a proportional relationship with a graph. The graph will be a line that passes through the origin (0,0).
- Step 1. Use points on the graph to make a table.
- Step 2. Find the constant of proportionality.
- Step 3. Write an equation.
- Let x represent the weight on Earth. Let y represent the weight on the moon.
- The equation is y = (1/6)x.
Analyzing Proportional Relationships Worksheets
This is a fantastic bundle which includes everything you need to know about the analyzing proportional relationships across 28 in-depth pages. These are ready-to-use Analyzing Proportional Relationships worksheets that are perfect for teaching students how to analyze proportional relationships and use them to solve real-world and mathematical problems. We will compute unit areas and other quantities, recognize and represent proportional relationships between quantities, and use proportional relationships to solve multistep ratio problems.
Complete List Of Included Worksheets
- Lesson Plan
- Analyzing Proportional Relationships
- Proportional or Not?
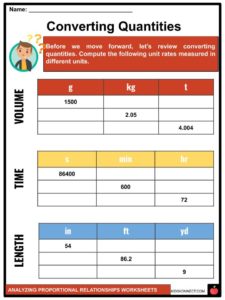
- Converting Quantities
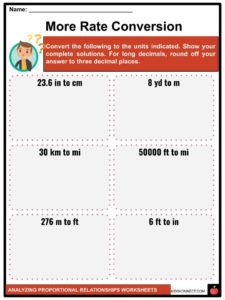
- More Rate Conversion
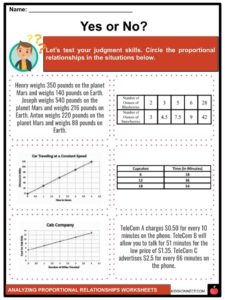
- Yes or No?
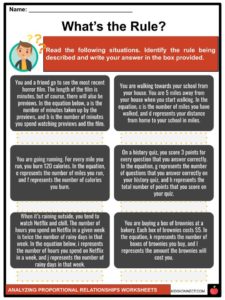
- What’s the Rule?
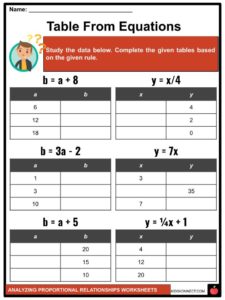
- Table From Equations
- Graphs and Equations
- Problem About Bikes
- Let’s Go Hiking
- Real Wor(l)d Problems
Link/cite this page
If you reference any of the content on this page on your own website, please use the code below to cite this page as the original source.
Link will appear as Analyzing Proportional Relationships Facts & Worksheets: https://kidskonnect.com - KidsKonnect, July 3, 2020
Use With Any Curriculum
These worksheets have been specifically designed for use with any international curriculum. You can use these worksheets as-is, or edit them using Google Slides to make them more specific to your own student ability levels and curriculum standards.