Premium
 Download
Edit
Download
Edit
Download the Line Plots Facts & Worksheets
Click the button below to get instant access to these worksheets for use in the classroom or at a home.
Download This Worksheet
This download is exclusively for KidsKonnect Premium members!
To download this worksheet, click the button below to signup (it only takes a minute) and you'll be brought right back to this page to start the download!
Sign Me Up
Edit This Worksheet
Editing resources is available exclusively for KidsKonnect Premium members.
To edit this worksheet, click the button below to signup (it only takes a minute) and you'll be brought right back to this page to start editing!
Sign Up
Not ready to purchase a subscription? Click to download the free sample version Download sample
Download This Sample
This sample is exclusively for KidsKonnect members!
To download this worksheet, click the button below to signup for free (it only takes a minute) and you'll be brought right back to this page to start the download!
Sign Me Up
Table of Contents
In this lesson, we will try to understand how we can use line plots to represent and interpret fractional data.
See the fact file below for more information on the line plots or alternatively, you can download our 28-page Line Plots worksheet pack to utilise within the classroom or home environment.
Key Facts & Information
SIMILAR DENOMINATORS
- In this section, we will start with simple data sets composed of fractions with similar denominators.
- How can we represent these data sets using line plots?
- Given 4 chances, how many times did 6 people flip a coin and land on heads?
- Since we know that there are 4 chances, meaning there are 4 equal parts, then we can divide the line plot.
- We can now assign a symbol that would represent a person.
- This symbol will be used for the line plot.
- Now, how do we interpret the line plot above?
- Since the circles represent one person, we can interpret the line plot like this:
- Given four chances, one person was able to flip a coin that landed on heads once.
- Given four chances, three people were able to flip their coins, which landed on heads twice.
- Given four chances, two people were able to flip their coins, which landed on heads thrice.
- No person was able to flip a coin and land on heads four times.
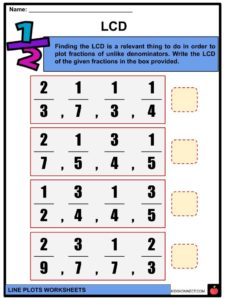
DIFFERENT DENOMINATORS
- In the previous section, our data set contains fractions of similar denominators. This time, our data set will be composed of fractions of different denominators.
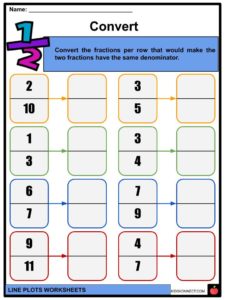
- The method to plot fractions of different denominators is to make all the denominators the same.
- LCD – Least common denominator is the lowest common multiple of the denominators.
- All we need to do now is to change the fractions in a way that their denominators will change to LCD.
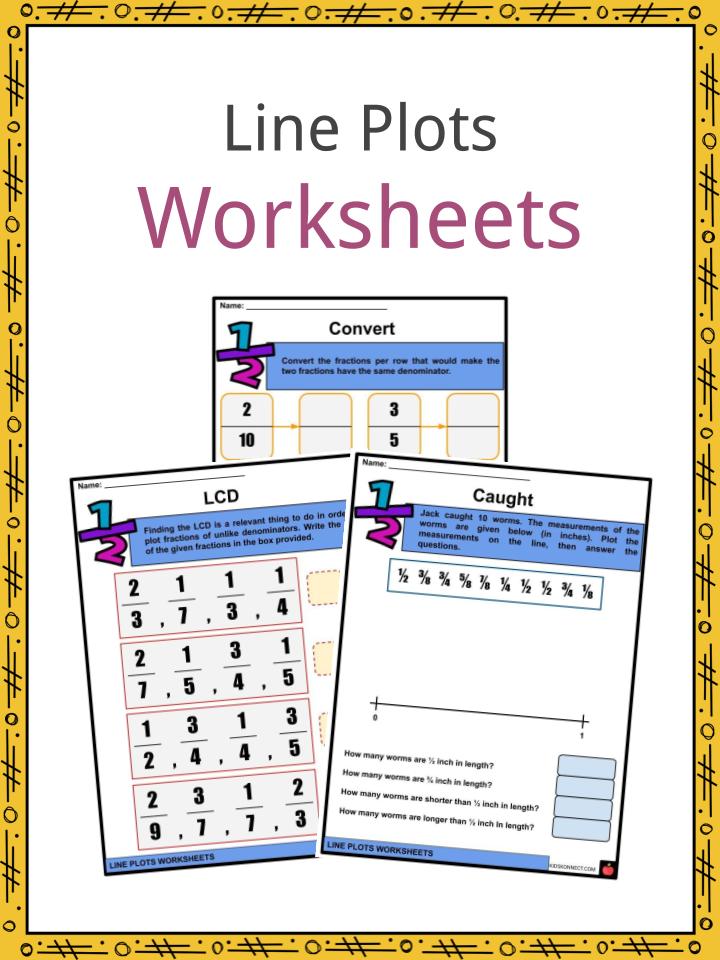
Line Plots Worksheets
This is a fantastic bundle which includes everything you need to know about the line plots across 28 in-depth pages. These are ready-to-use Line Plots worksheets that are perfect for teaching students how we can use line plots to represent and interpret fractional data.
Complete List Of Included Worksheets
- Lesson Plan
- Line Plots
- Convert
- LCD
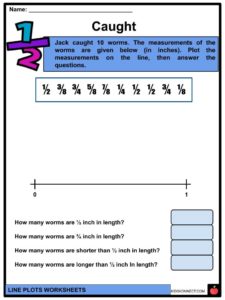
- Caught
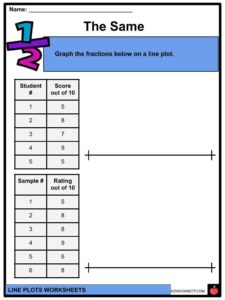
- The Same
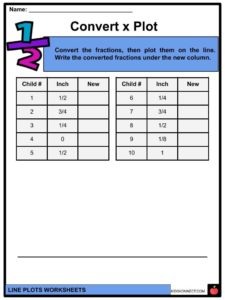
- Convert x Plot
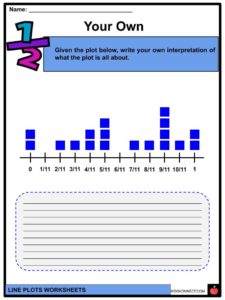
- Your Own
- Weeks
- Paper
- Label
- Plot
Link/cite this page
If you reference any of the content on this page on your own website, please use the code below to cite this page as the original source.
Link will appear as Line Plots Facts & Worksheets: https://kidskonnect.com - KidsKonnect, June 24, 2020
Use With Any Curriculum
These worksheets have been specifically designed for use with any international curriculum. You can use these worksheets as-is, or edit them using Google Slides to make them more specific to your own student ability levels and curriculum standards.